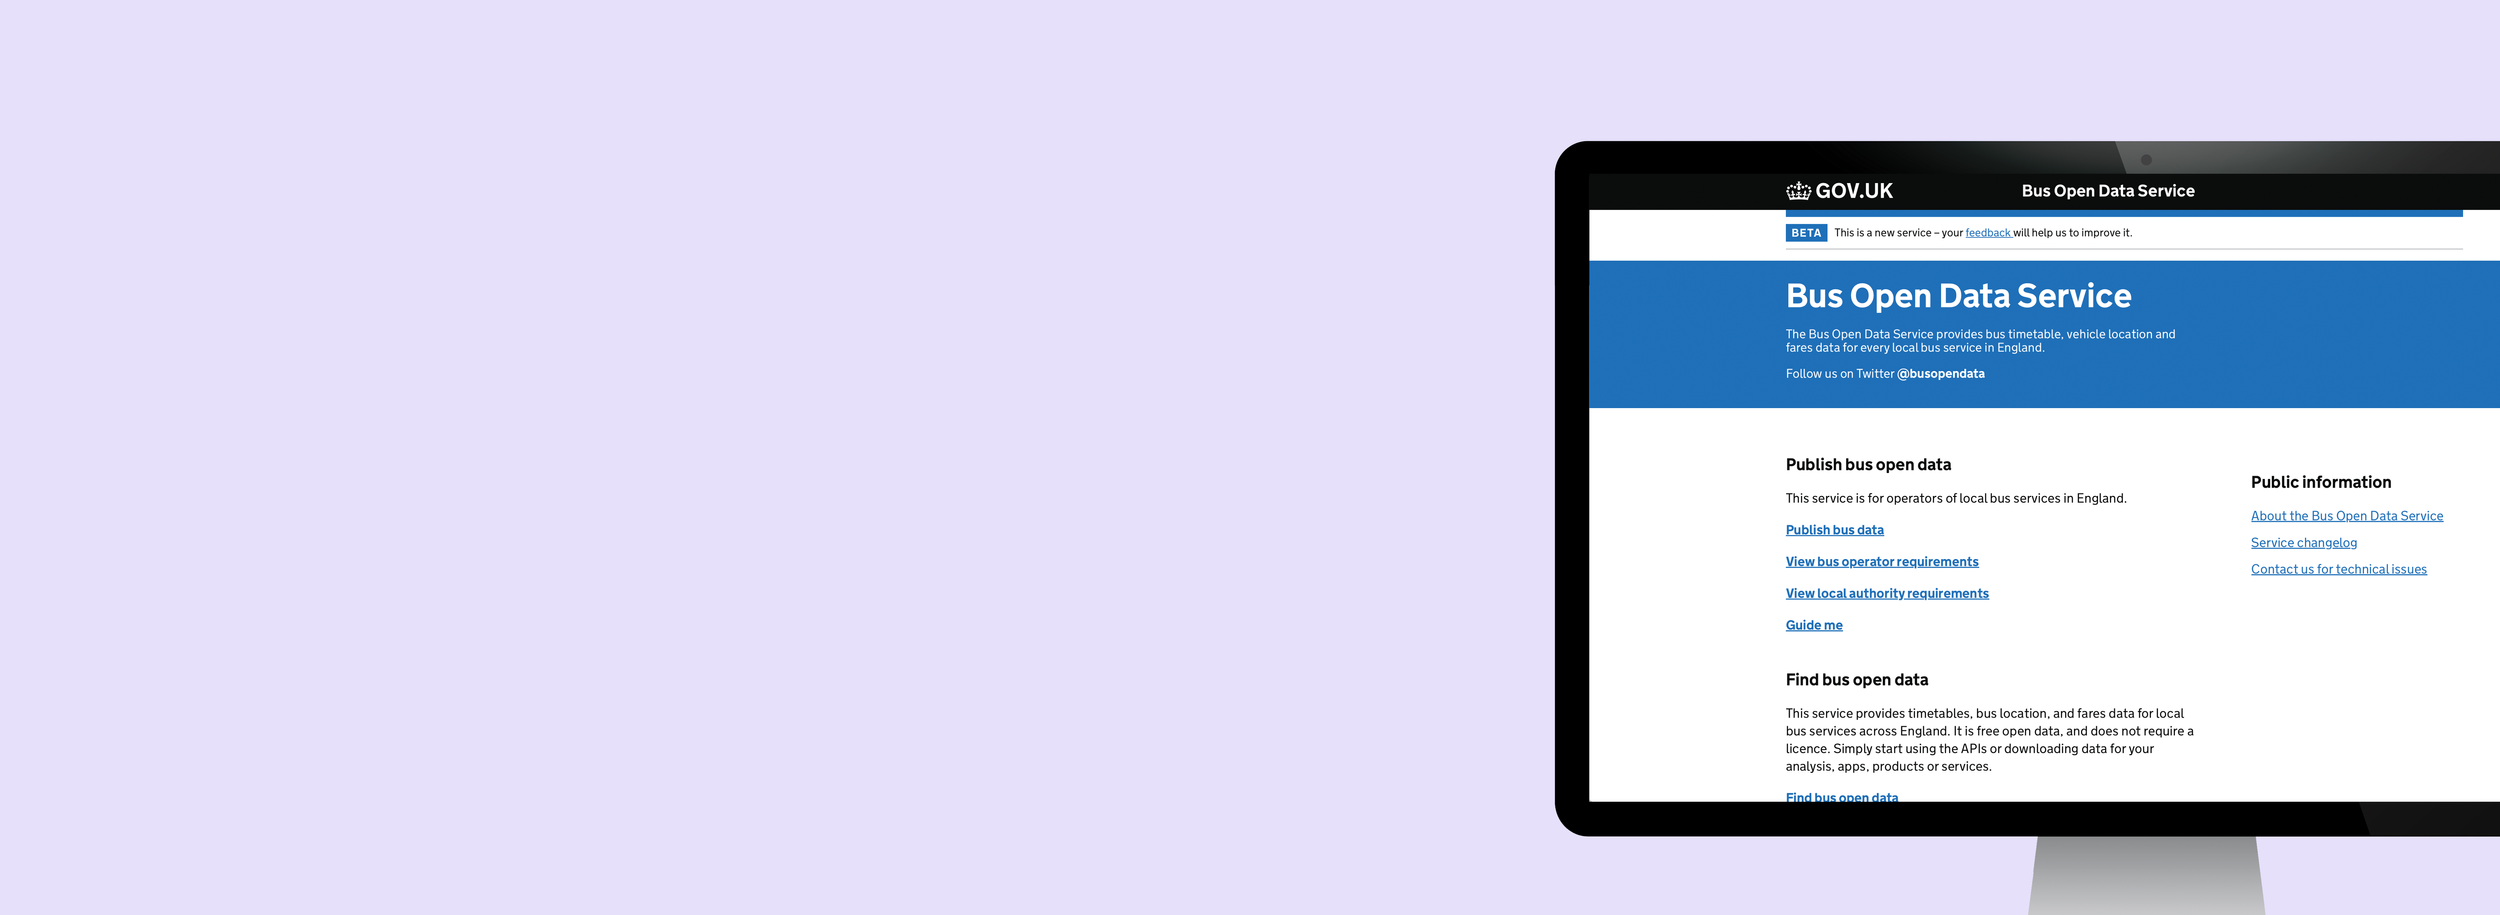
Jiayu
Jiayu
Full stack experience designer
 

Bus Open Data

How can we drive more people to choose public transport in the UK?

Senior User Researcher and Designer March 2021 - February 2022

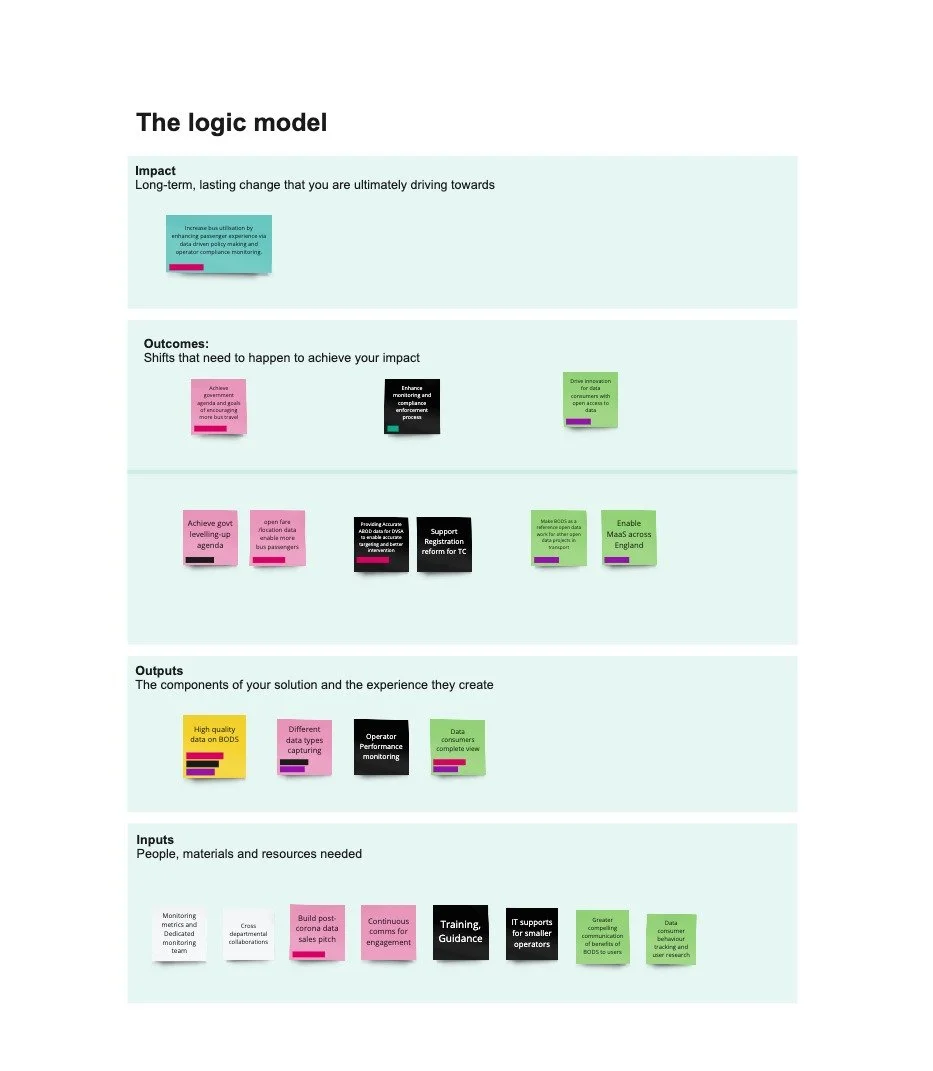
📢 Client challenge: The Bus Open Data project represents a proactive response to the evolving public transportation landscape. By embracing open data solutions, the Department for Transport aims to enhance the accessibility, transparency, and efficiency of bus services, improve passenger experience and promote sustainability. However, given the considerable digitalisation gap within the bus industry, the project team faces multiple challenges from the stakeholders involved in ensuring its success.

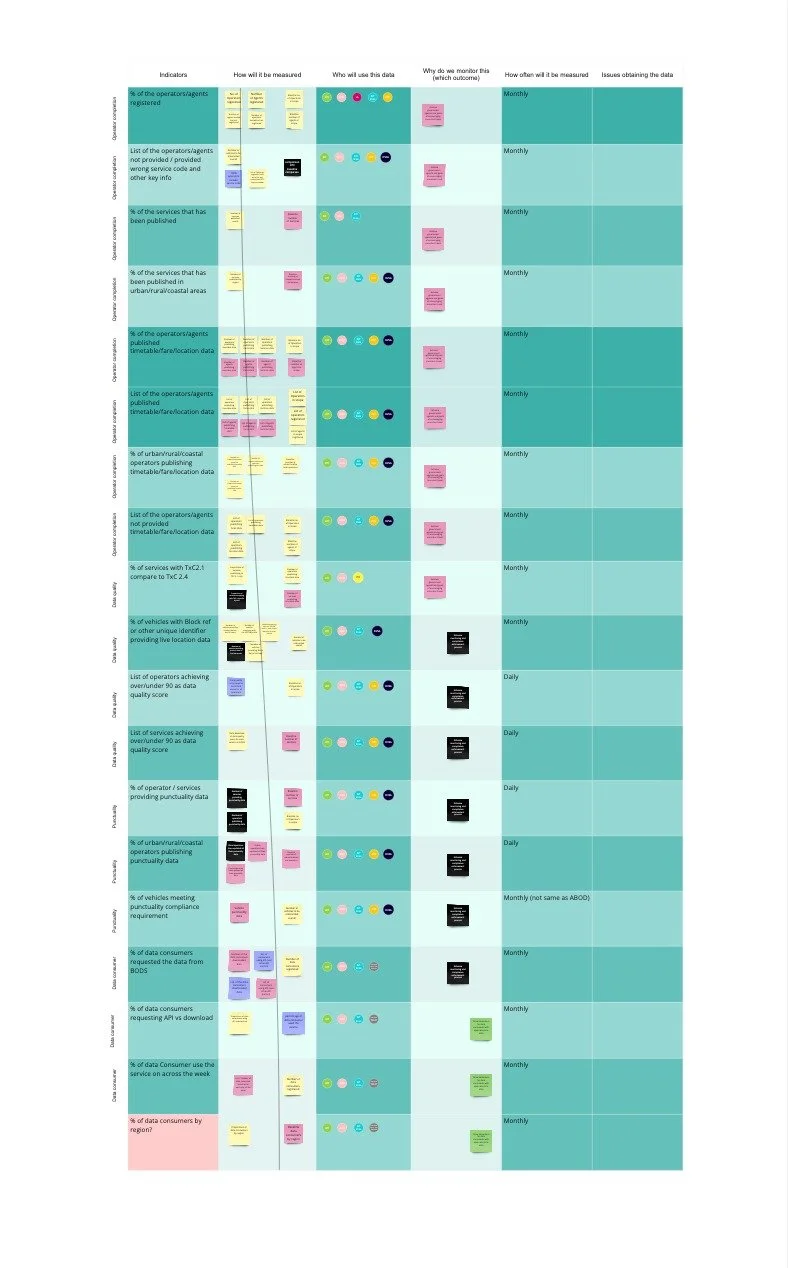
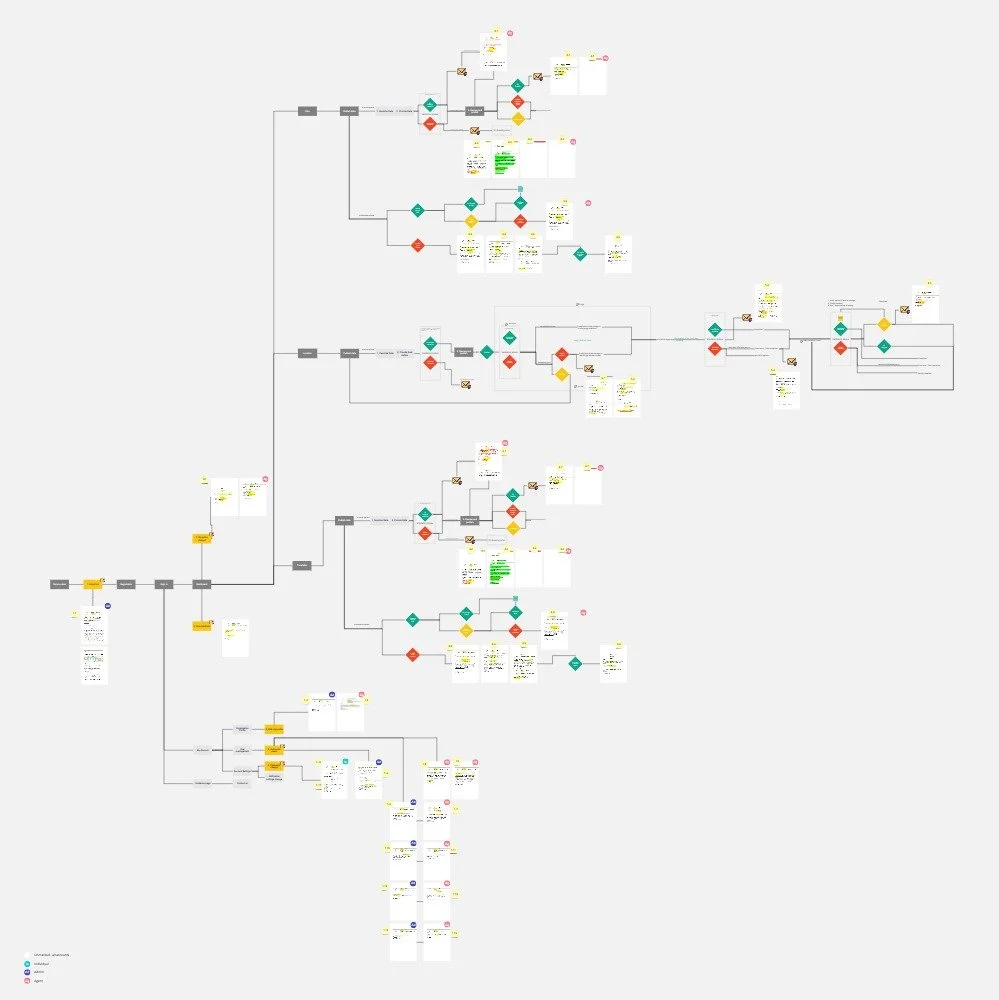
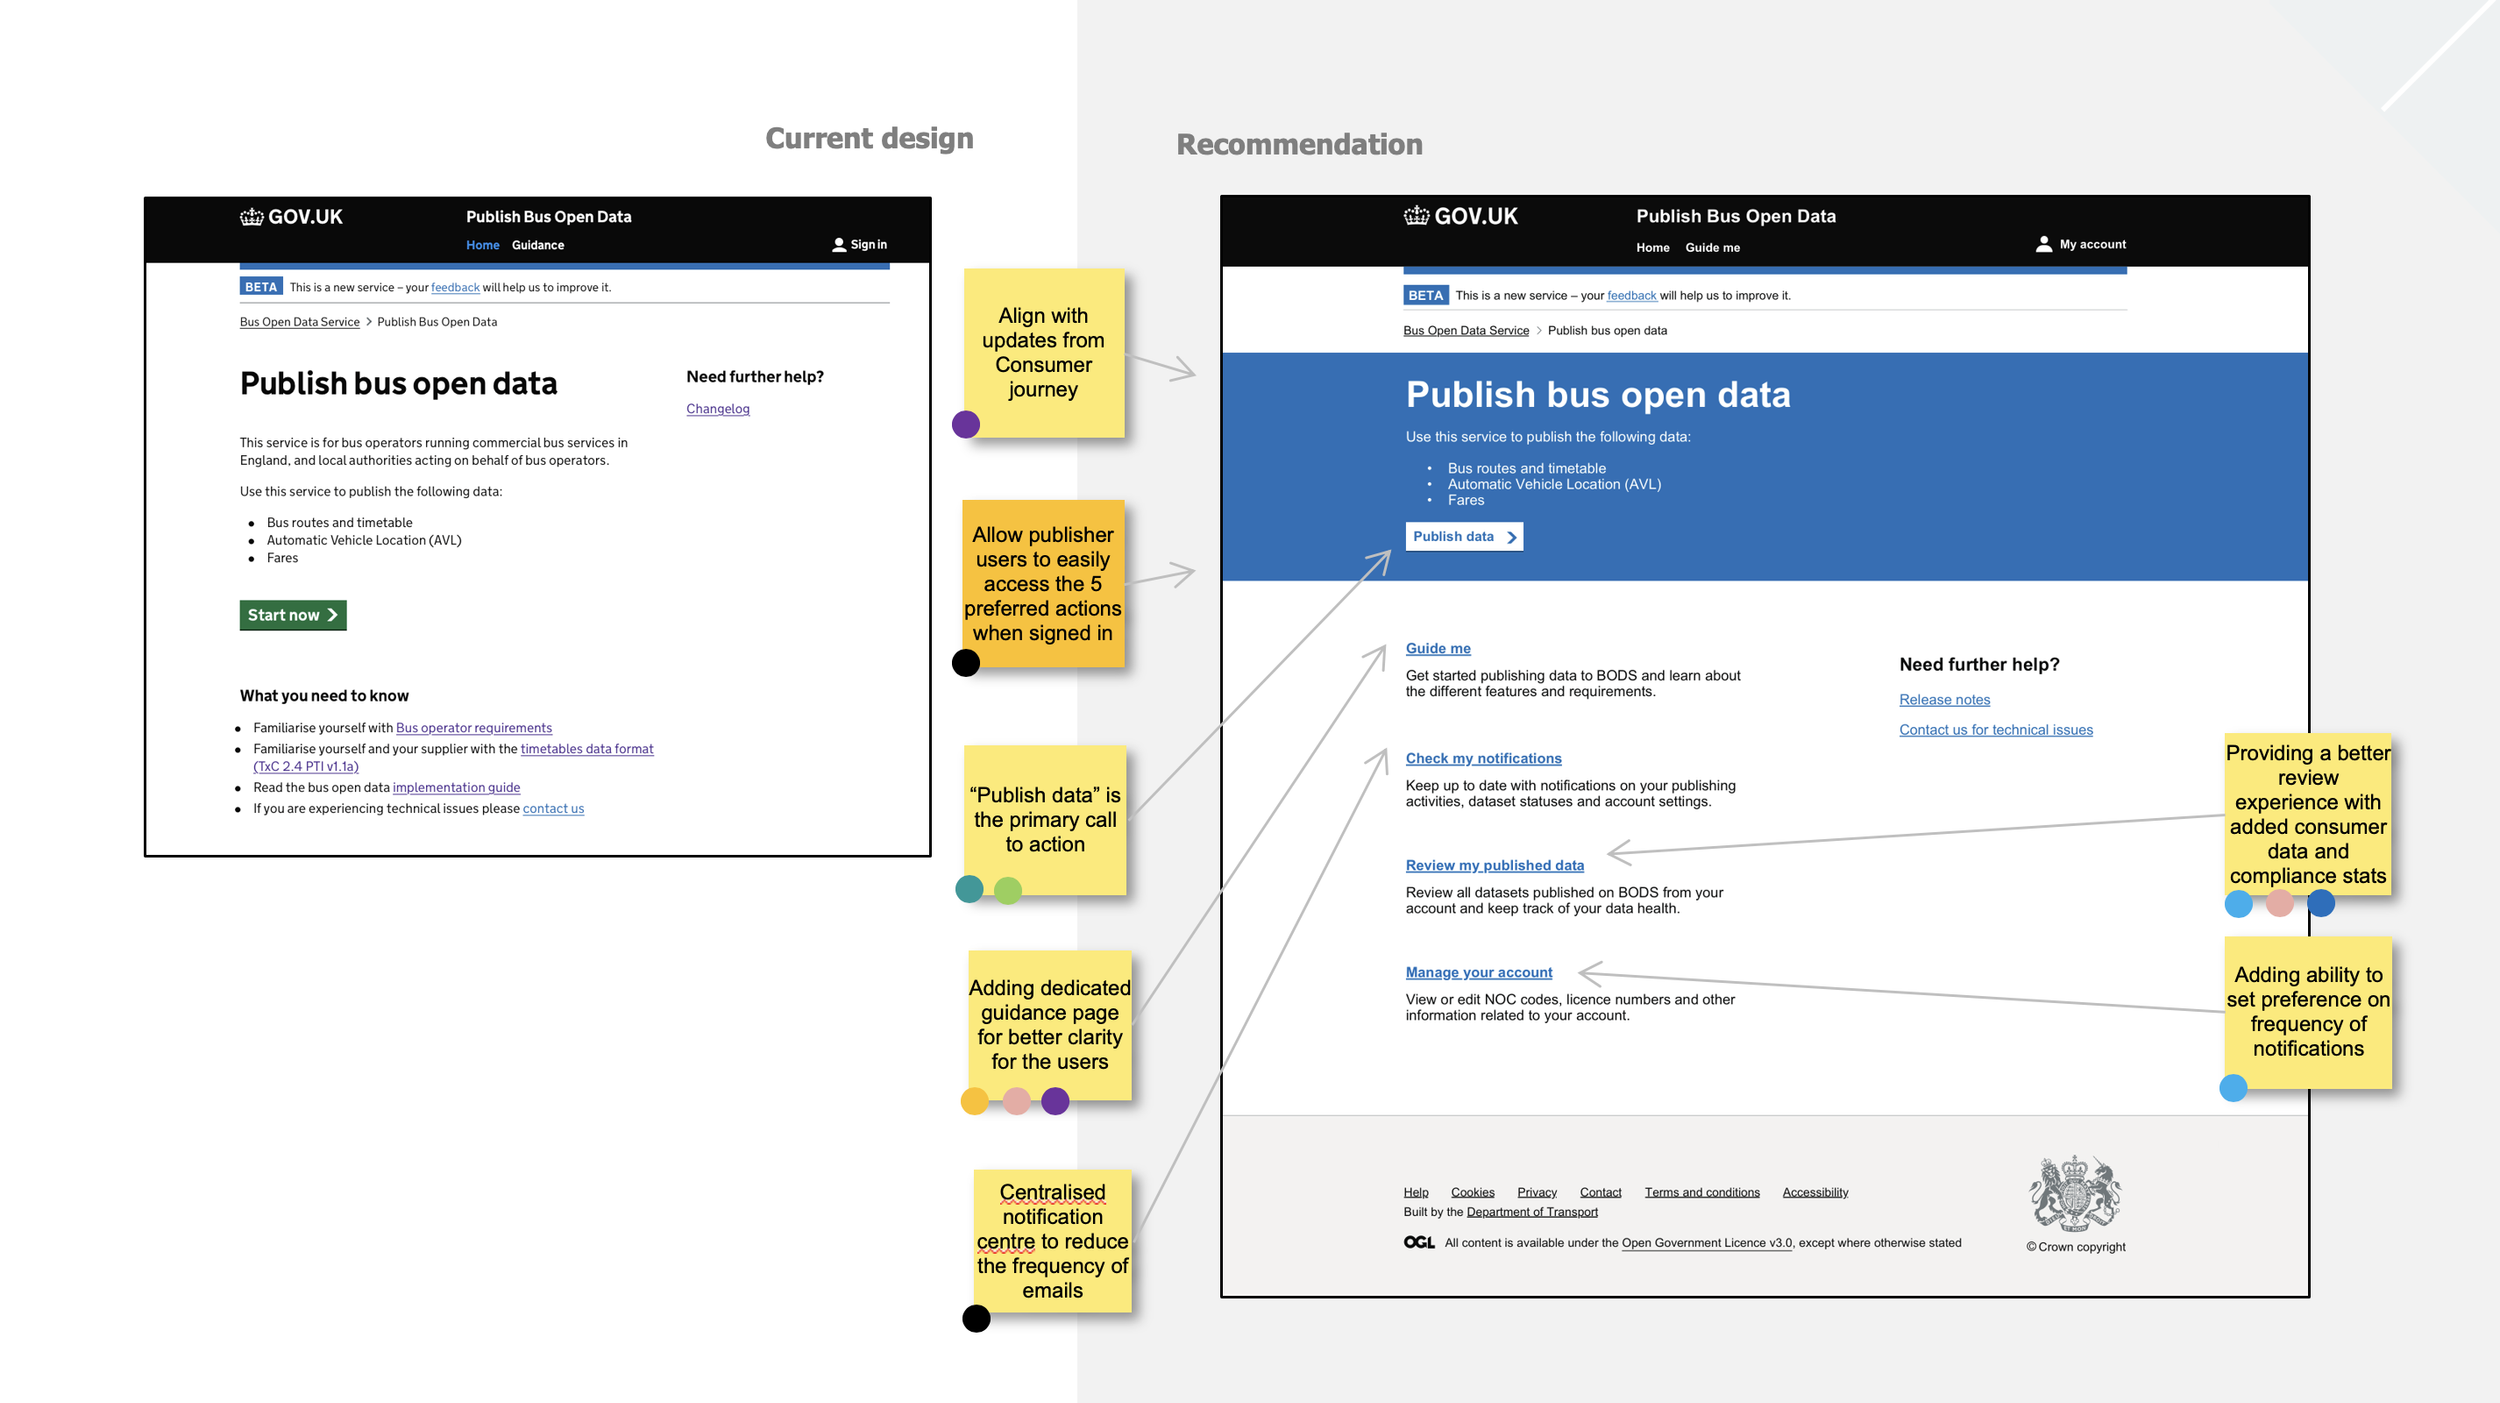
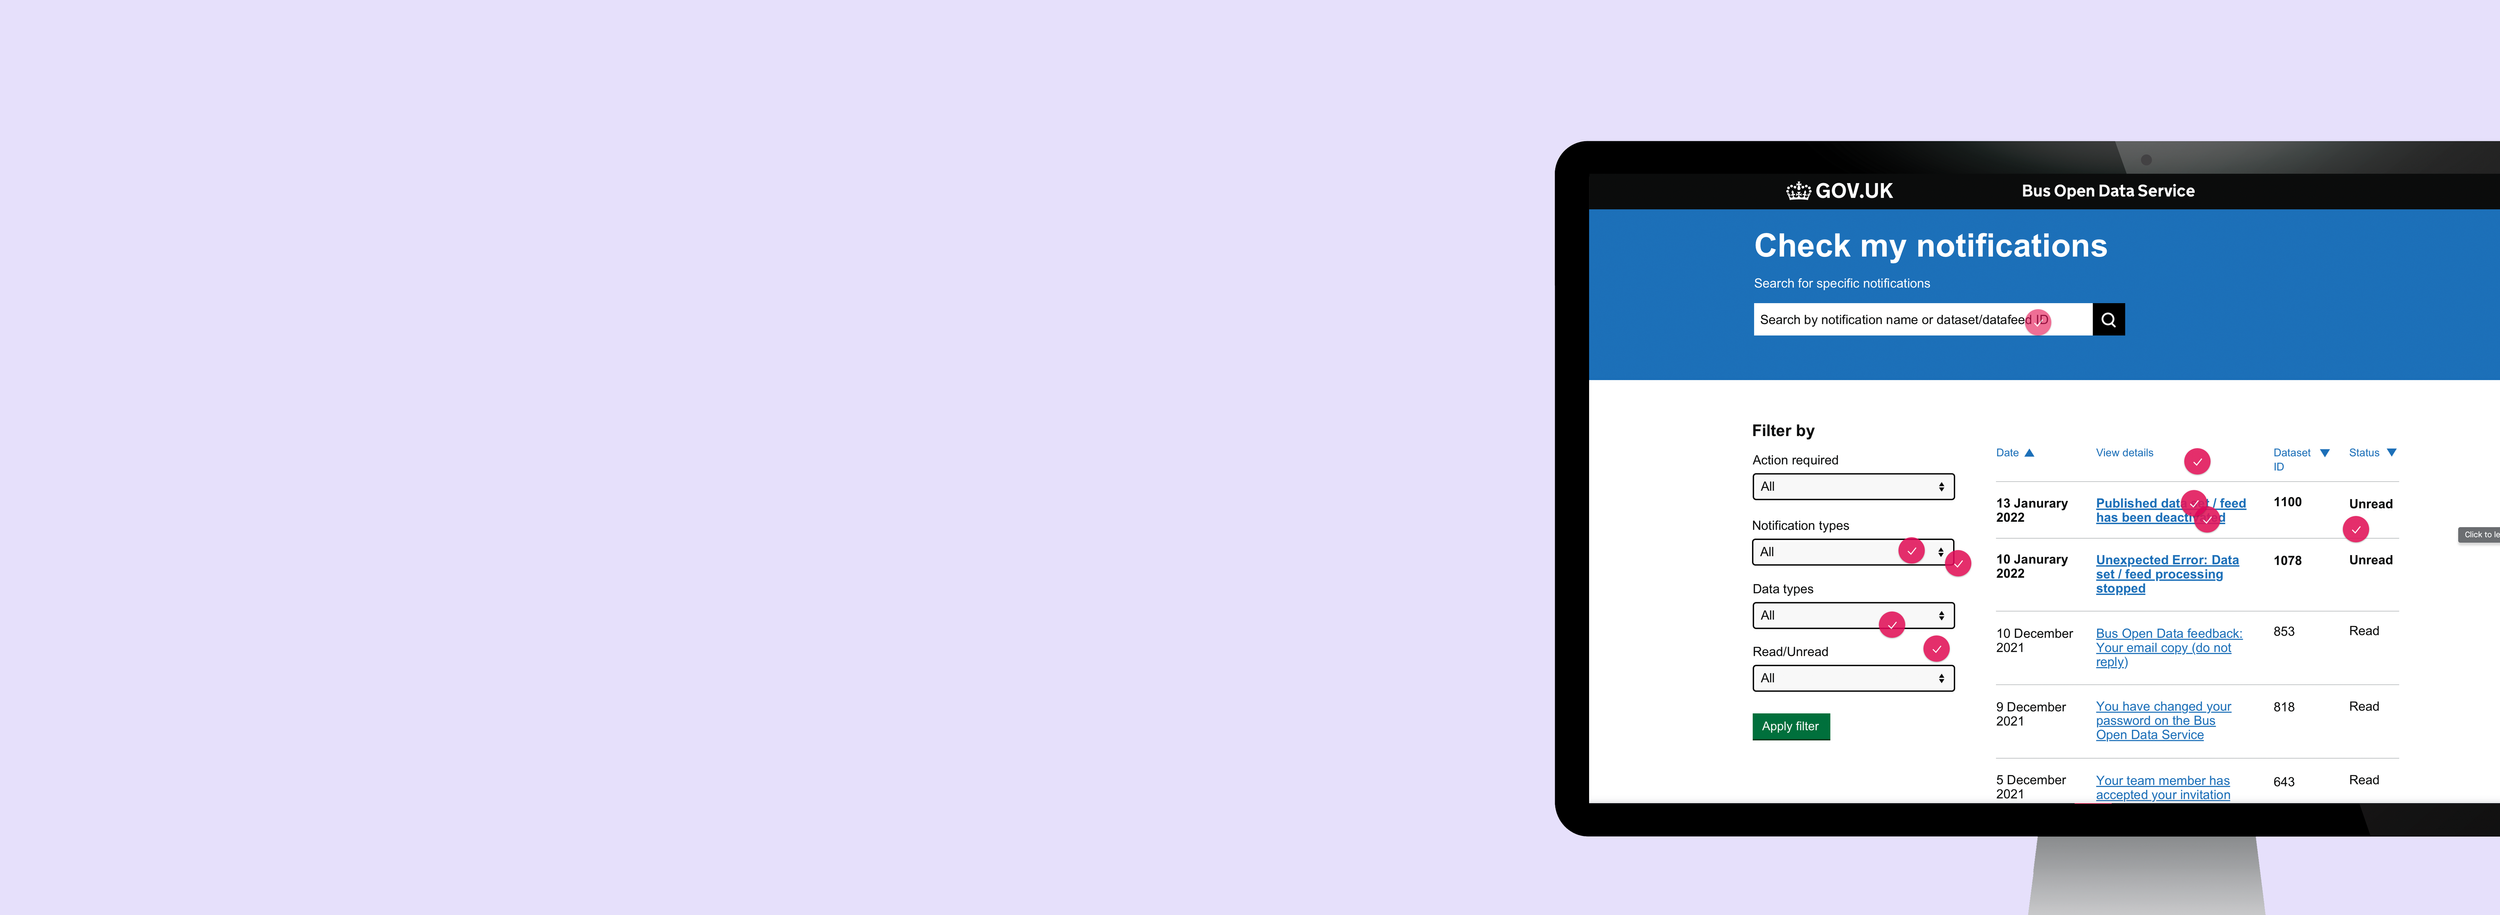
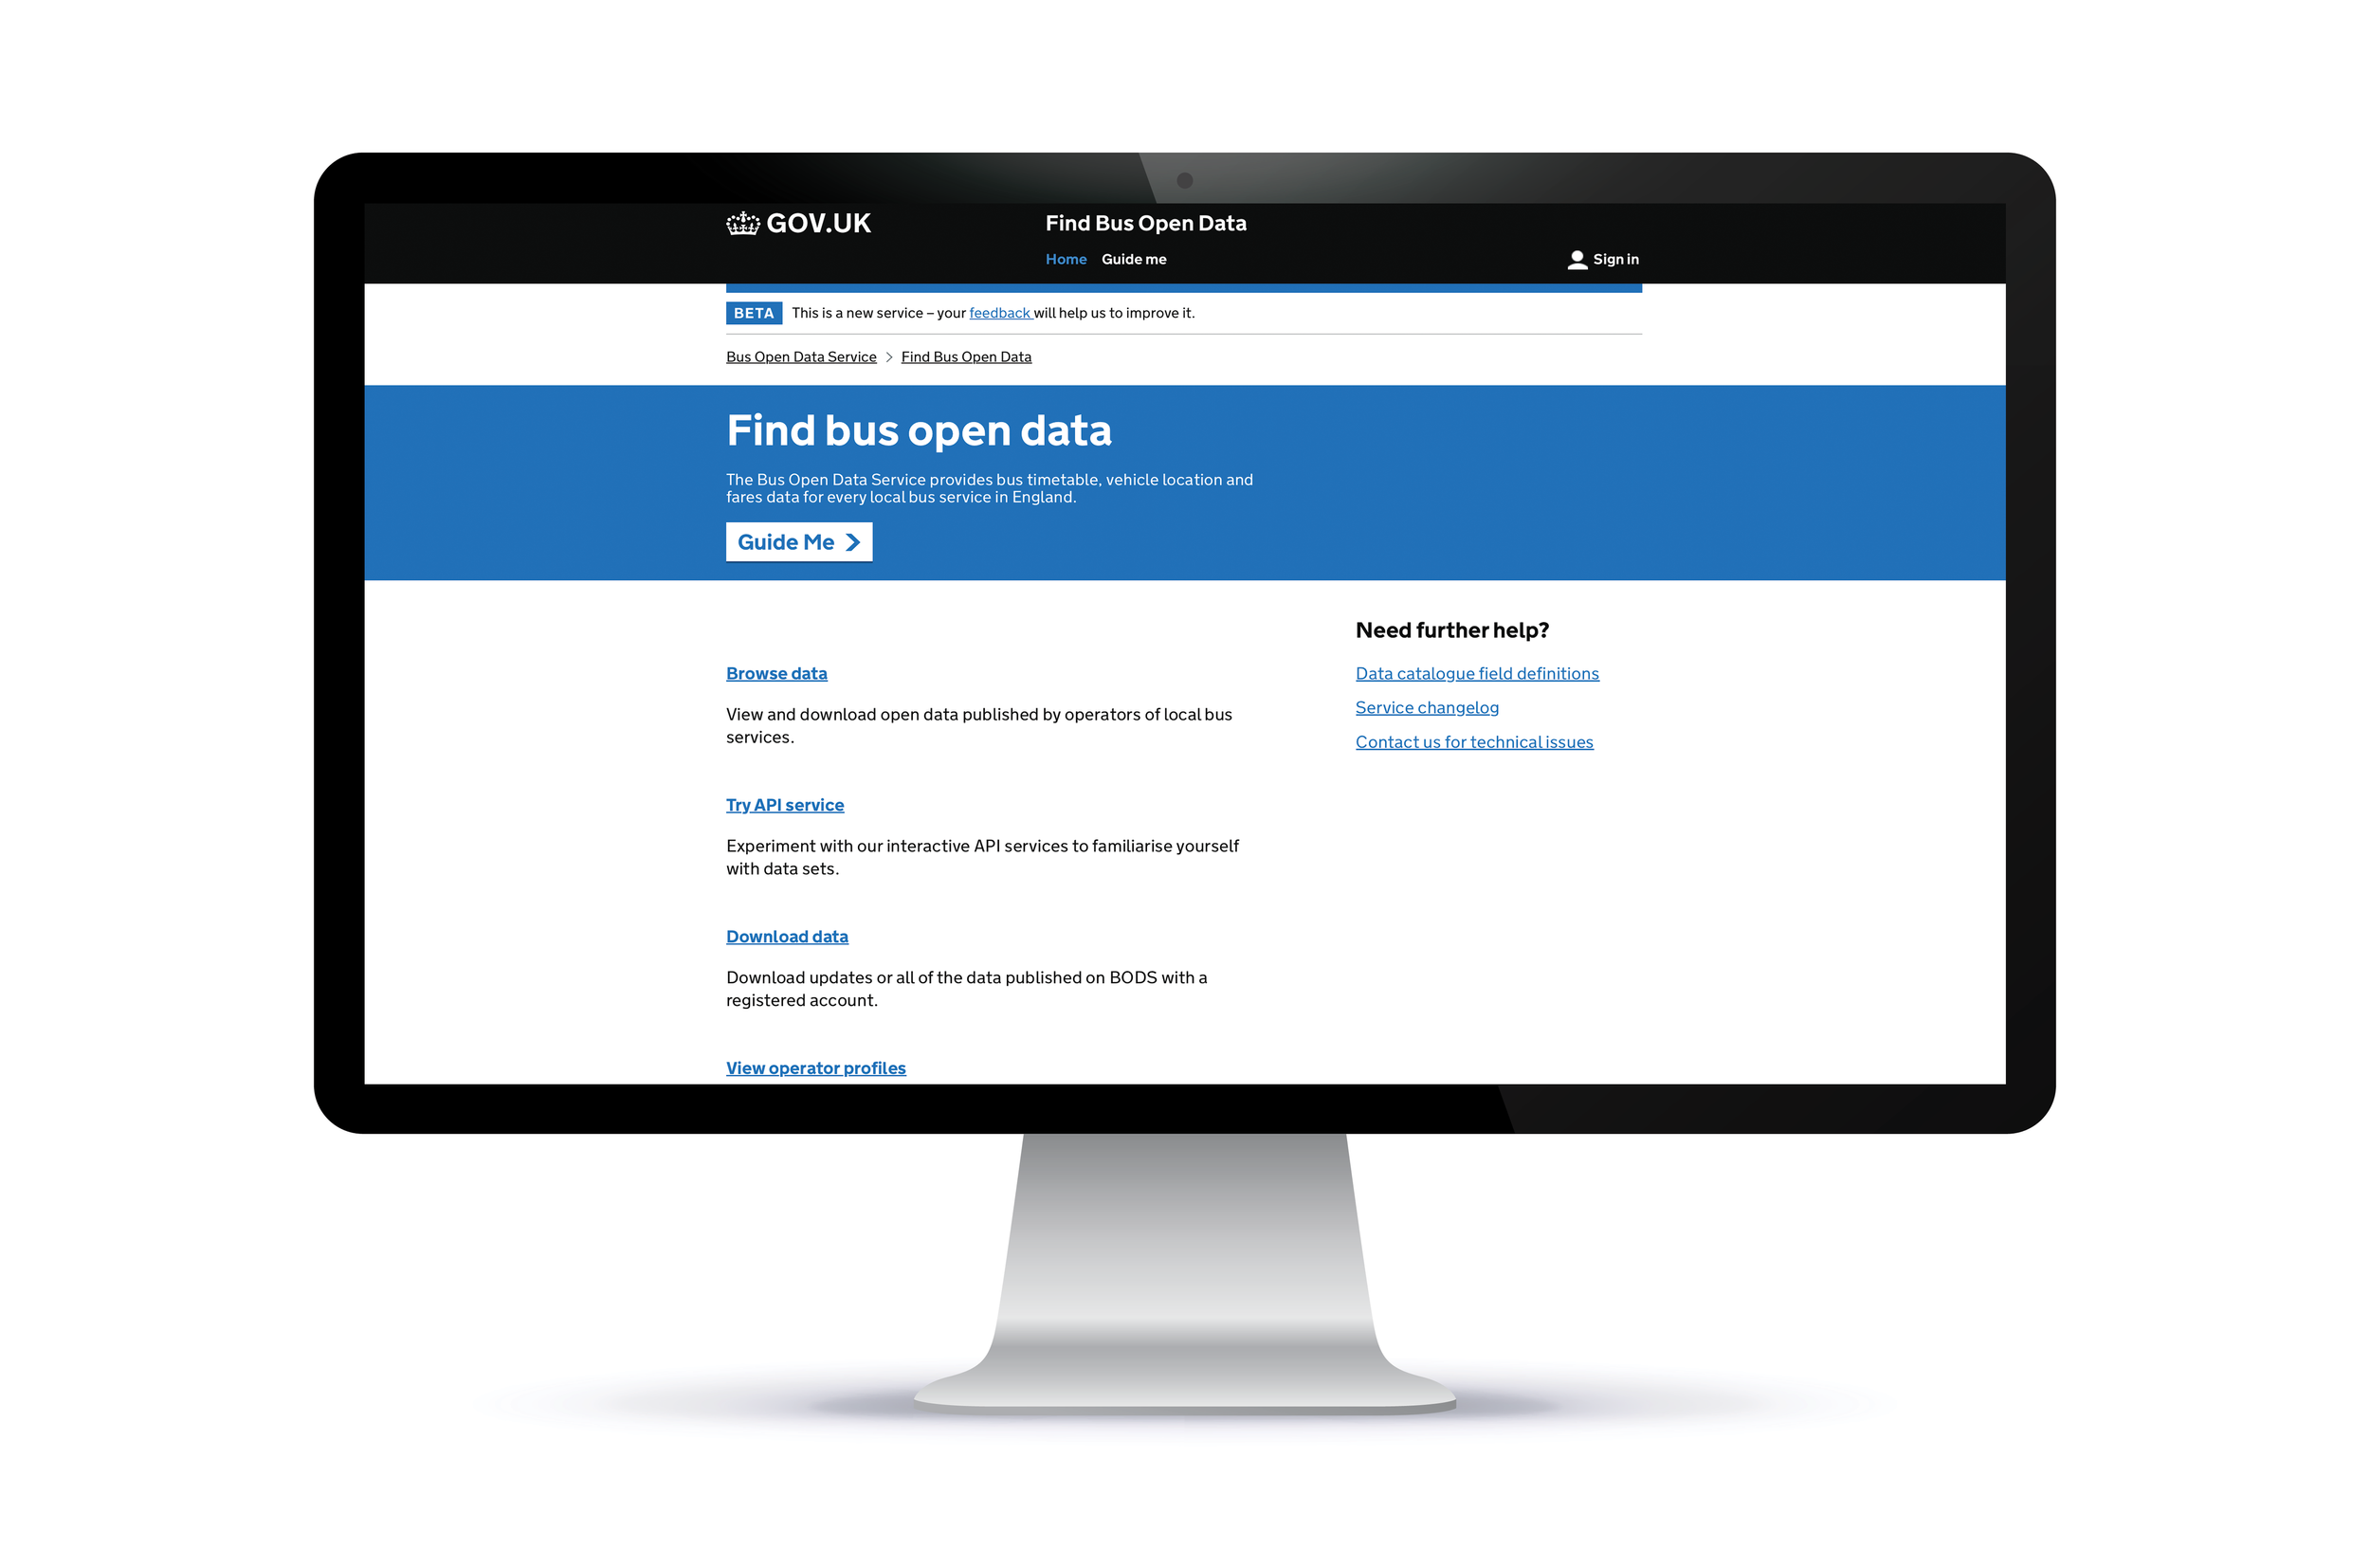
📁 Responsibilities: Demonstrated ability to navigate complex challenges. Uncovered crucial user pain points within a diverse user base through rigorous qualitative and quantitative research. Facilitated co-creation sessions with Subject Matter Experts, regulatory bodies, and users to ideate innovative solutions. Initiated policy and stakeholder alignment sessions to identify priority areas for iterative improvements. My work encompassed various research streams, including compliance and monitoring, the data publisher journey, enhancing data consumer experiences, investigating data quality, and discovering disruptive services.

🛠️ Tools: Miro | Jira | Trello | Slack | MS survey form | Sketch | Invision | Zeplin


Research challenge #1

How do we effectively align various government agencies and stakeholders on a shared strategy?

 
BODS1.png

An intriguing aspect of this project was navigating the intricate web of stakeholders. It became evident that various stakeholders have their unique motivations, sometimes leading to conflicts with others in the project ecosystem. Recognising this dynamic, I took deliberate steps to align these divergent visions and foster a shared understanding.

Relational mapping
This tool helped me to visualise and analyse the connections, dependencies, and interactions among stakeholders, enabling us to plan the upcoming workshop more effectively.

Logic model workshop
I noticed there was no logic model to assess inputs and outputs or align our impact goals. I organised a workshop to create the logic model and adopted it in the evaluation process.

Stakeholder interviews
Engaging in stakeholder interviews allowed us to uncover service performance metrics relevant to them and determine the optimal frequency and methods for measurement.

What we achieved

We ensured that all relevant stakeholders were consulted by establishing a clear and shared vision guided by a logical model. This collaborative approach allowed us to address conflicting viewpoints and ultimately enhance the program's effectiveness.

Research challenge #2

How can research facilitate positive behavioural change?

 
BODS2.png

The bus industry has been slow to embrace digitalisation fully. However, it is crucial for passenger experience to provide accurate and high-quality data to the journey planner tools. The central challenge lies in persuading and supporting bus operators to provide realiable timetable, location, and fare data. But, in the absence of policies or legislative mandates, how can we motivate a behaviour change and expedite the industry-wide shift towards digitisation?

Quantitative research

By using surveys, I was able to identify the critical obstacles hindering behavioural change and to quantify the potential benefits of change. We have shared the surveys with bus operators, local authorities, regulatory bodies, and data consumers.

Publisher journey: painpoints and opportunities

Qualitative research

As the size of the operator often mirrors the challenges they encounter, I have categorise the operators based on their operational size. Interview with them enabled us to uncover some of the less recognised pain points, such as “shortage of driver” and “issues with disruption information”.

Heuristic assessment

I have conducted a heuristic assessment on version one of the product. It allowed me to proactively detect and address usability problems early in the design process. The insights gained from the evaluations also gave us valuable lessons that we carried into subsequent iterations.

Backlog and service desk findings

I have also engaged with the service desk responsible for user support to uncover recurring issues. After categorising the support tickets they received, we analysed trends relating to technical capabilities and awareness of available support. We also delved into previous discussions and backlogs to identify emerging feature requests.


Outcome

We identified two critical areas for improvement that directly benefit bus operators and other data publishers.

  • One recurring challenge we've identified revolves around the frequency of notifications. Bus operators often find themselves strapped for time, focusing on ensuring the seamless daily operation of their business. However, notifications can become a distraction, especially for smaller companies without dedicated IT support. To address this, I conducted a thorough notification audit to streamline the process, reduce redundancy, and alleviate user frustration.

  • Another significant factor influencing a positive shift towards maintaining data quality is simplifying the quality-checking process, especially for users with limited data expertise. To facilitate this, I've created a mock-up for a summary page highlighting data issues, aiding in troubleshooting.

Additionally, I've designed updated wireframes to align with UI and UX recommendations derived from our research findings.

Notification audit

Mid-fidility screen_Create product groups

Research challenge #3

How should the research team and the industry overcome the challenges posed by COVID-19?

 
BODS3.png

 During my involvement in the project, it coincided with the challenging period of COVID-19 restrictions. These circumstances had a profound impact on both the project itself and the bus industry as a whole. Bus operators were striving to recover from the pandemic's effects and grappling with additional challenges, such as driver shortages due to job shifts to HGV (Heavy Goods Vehicle) roles. These developments posed significant challenges to our research efforts, affecting how we conducted research and the availability of research participants.

Working with associations

I noticed that when the research participants perceive the value in the research sessions, we tend to achieve excellent participation rates. Nonetheless, there are instances where we struggle to reach the desired numbers. That's when I discovered the option of collaborating with associations, which can offer valuable qualitative insights into the common pain points their members are facing. Additionally, they can assist in conducting quantitative research, including surveys that can be shared with their member list.

Miro, Invision and open questions

We used various collaboration tools, such as Miro, Teams and Invision to connect with stakeholders and interviewees, conducting each session virtually. While we couldn't carry out in-person contextual inquiries or shadowing, we employed open-ended questions to grasp their daily responsibilities and challenges. This approach allowed us to gain valuable insights into how we can facilitate the behavioural changes necessary to ensure the sustained success of this platform for all involved parties.

Outcome

The Bus Open Data project stands as a remarkable success story, demonstrating open data's transformative potential in improving countless individuals' lives. It showcases how, through gradual adjustments, we can foster a shift in mindset within an industry as traditional as the bus sector.

The service has been widely adopted by well-known journey planners such as Citymappers, etc:

33,900 Buses

3000 + Service users

4.5 Billion bus journeys

Reflection

Scale of surveys

Our surveys faced limitations in terms of scale, primarily due to time constraints. Each workstream yielded a restricted number of survey responses. Additionally, we observed a slight selection bias, as participants in the second version remained mainly similar to those in the first version. While we successfully engaged with major bus operators and data consumers, our efforts to recruit new mid-sized and small businesses encountered challenges.

Social and economic behavioural change

We initiated collaborations with university researchers to delve into our program's broader societal and economic impact. I am keen on exploring this further, seeking advice and best practices to foster continuous positive behavioural changes and extend our influence towards the general public to encourage increased public bus travel.

Webpage activity analysis

Analyzing user data posed challenges, primarily due to compliance requirements. In the initial version, monitoring and feedback mechanisms were not intentionally integrated, resulting in minimal data for the analysis of site activities. For our forthcoming version 2, we have recommended including these features. Acquiring this additional dimension of data would provide an additional source of insights to improve the experience and design of the platform.